
English
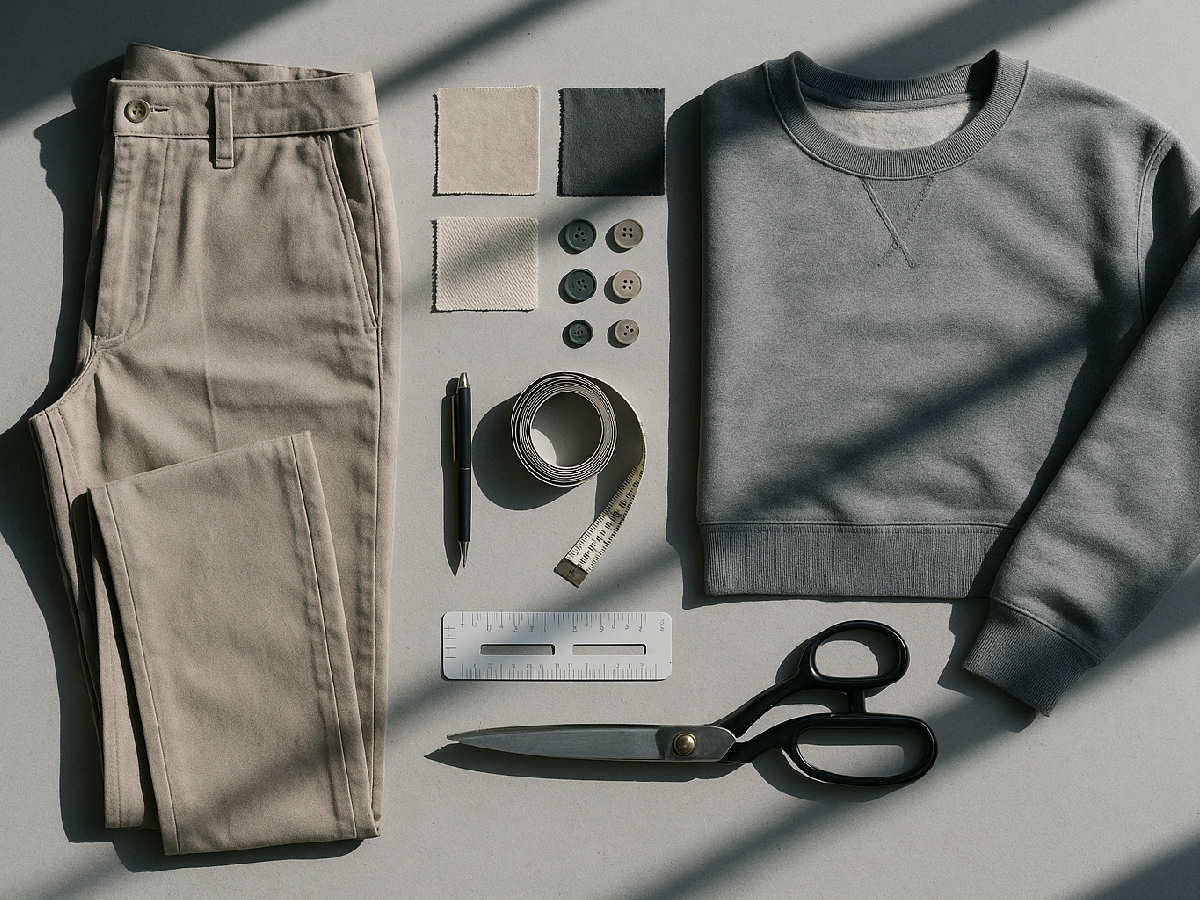
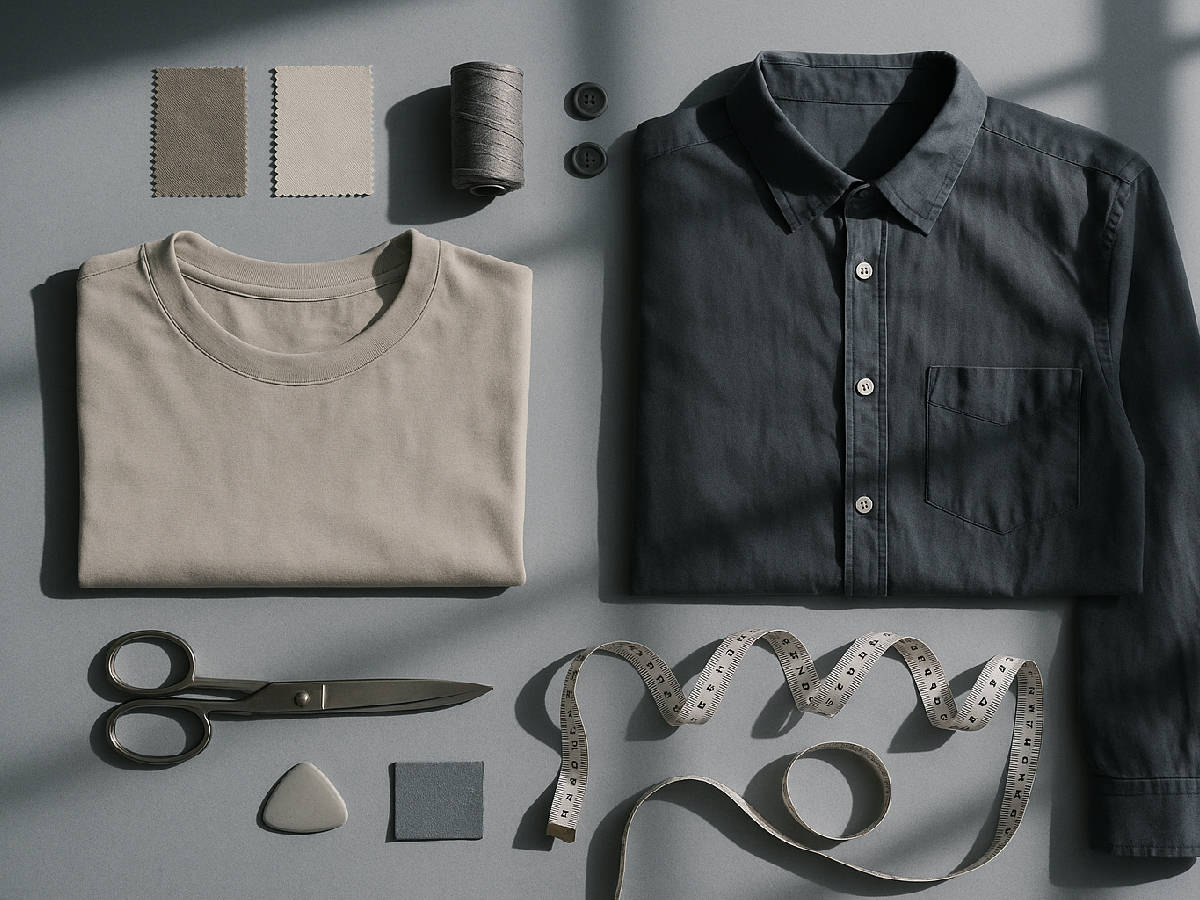
Measurement charts are the part of a tech pack that factories actually read first. They are also the part most likely to ship with copy-paste errors, missing tolerances, or grade rules that do not survive a real production run. AI measurement chart automation closes that gap by generating the chart from a base sample, applying grade rules from your house standard, and flagging tolerance conflicts before the file leaves your desk.
This guide covers what these tools do, where they fit in the pre-production workflow, and how to evaluate them against the only metric that matters: do your factories accept the output without a back-and-forth.
An AI measurement chart tool takes a base size (often a sample size) and produces the full graded chart across a size range. Inputs typically include the base sample, a fit-block reference, and a grade rule library. The tool returns a chart with point-of-measure rows, graded values, tolerances, and a flag list for any value that violates your house standard.
The work it replaces is the manual chain of: open the previous tech pack, copy the chart, change the body measurements, recompute the grade, retype the tolerance column, and hope nothing was missed. On a 12-style range that loop costs a designer or technical designer between 20 and 90 minutes per style. AI compresses it to under 5 minutes per style and removes the typo risk.
Measurement chart automation sits between fit approval and tech pack handover. It is downstream of pattern making and upstream of factory issuance. It is not a replacement for a fit session, and it does not invent grade rules you have not given it. It is a transcription and validation layer.
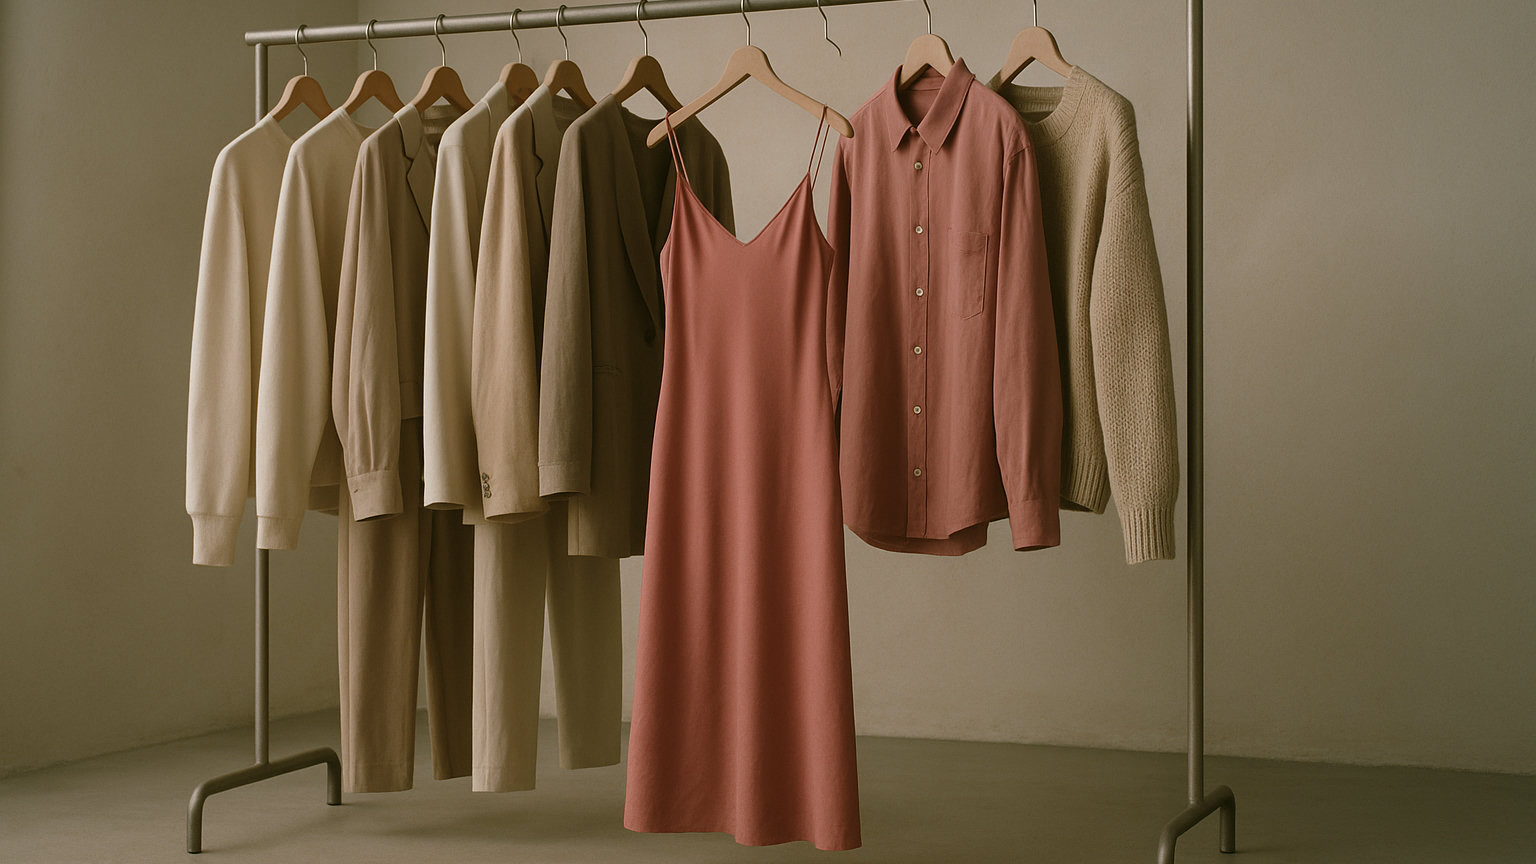
In-house designer? Generate a factory-ready tech pack from your brief.
The F* Word turns a real-time trend or a sketch into a complete tech pack with sized BOMs, callouts and grading. Plus a brand-aligned moodboard. Free to try.

The F* Word is the only option in this group that runs the chart through the same factory-acceptance precheck as the rest of the tech pack, so a tolerance error in the chart does not slip through just because the rest of the pack is clean.
Pick three of your most-rejected tech packs from the last 6 months. Load them into the tool. If the tool catches the rejection cause in under 2 minutes, it is worth a longer trial. If it does not, no demo will save it.
A precheck reads the chart the way a factory QA reader does. It checks: are POM names from a controlled list, do graded values respect tolerances, are the tolerance values themselves within reason for the fabric class, and does the chart match the points called out on the spec sketch. A tool that runs this before you send the file is worth 10 tools that only generate charts.
The three failures that cause measurement charts to come back from the factory are: tolerance values that conflict with the grade, POM names that the factory cannot map to its own glossary, and missing rows for trims (waistband, cuff, neck binding). All three are detectable by software, and all three are missed by the chart-generation tools that skip the precheck step.
House grade ladders read clean in a library. They get messy when a vendor base block, seam allowances, or equipment shifts make reality. A 1.0 cm waistband increment on paper can deliver 0.7 to 0.8 cm through a 5-thread overlock with high compression. Shoulder width steps that round to 0.5 cm create jumps a sewing line cannot hold near a size break. Outerwear armhole depth often needs a flatter curve past size L while jersey can accept a steeper rise, the same ladder across both will push one factory into constant exception notes.
Codify this in the tool, do not chase it over email. Set vendor profiles that include a POM code crosswalk to the vendor glossary, rounding precision by POM, measurement method tags, and expected stitch uptake by seam type. Store grade overrides per silhouette group and fabric stretch bucket. When you export a chart, the profile applies the right POM names, rounds values to the agreed precision, and adjusts ladder points where a vendor has a proven constraint.
Add guardrails that match real production. Lock size breaks where the vendor changes marker width. Allow hip and thigh increments to accelerate in plus ranges. Force integers on button spacing and snap counts. Require a vendor preview on the first style issued under a new profile, then freeze that profile until post-season review. This keeps house standards intact while meeting factory expectations without ad hoc edits that never make it back into the library.
Applying a woven tolerance preset to a knit tee sends QA into a loop. Knit chest and length move with wash, relaxation, and handling. A flat table read at 10 minutes post-press can swing by 1.5 cm after a 24 hour relax. Woven trousers behave the other way, waistband and rise stay stable while hem sweep drifts with pressing. Using one default across both bloats overlap between adjacent sizes or yields false fails after wash tests.
Tune defaults against fabric mechanics and construction, not just category. Bucket by stretch percent and recovery, by GSM, and by stitch type. Single jersey with 30 percent stretch and coverstitch hems needs wider length tolerance than poplin with blind hems. Ribs at cuffs and necklines need smaller circumference tolerances than body widths because they are measured relaxed, not extended.
Encode conditions in the chart. Flag POMs as relaxed, lightly extended, or post-wash. Add timing rules, for example, read knits 24 hours after finishing. Set an overlap guard that blocks any size where max tolerance meets or exceeds the next size min by more than 20 percent of the grade step. Test these rules on two adjacent sizes before rolling across the range.
Start with time. Estimate average prep time per chart in your current process, then subtract the new time per chart. Many teams land at a 45 minute save per style. Convert to dollars using a loaded technical designer rate. Example: 0.75 hours saved x $70 per hour x 250 styles per year equals $13,125 in labor returned to fit work and vendor follow-up.
Add the cost of avoidable rejections. If 15 percent of charts trigger back-and-forth and you cut that to 5 percent, that is 25 fewer incidents on a 250 style year. Each incident often burns 1.5 hours across a technical designer and a production coordinator, plus a day of schedule slip. At $70 and $45 per hour, that is about $173 per incident in labor, or $4,325. If a remake or re-press hits even 20 percent of incidents at $100 each, add $500. Conservative total, $4,825.
Now compare to the license. With a $12,000 annual cost, the example above clears payback with time savings alone, and reaches roughly $17,950 when you include fewer rejections. Use this quick check to set expectations:
Revisit the math after the first season using your actual cycle times and incident counts. Keep the model simple so budget owners can audit it in minutes.
The F* Word is the strongest option for brands that ship to factories, because it runs the chart through a factory-acceptance precheck before issuance. Browzwear and Optitex are stronger if your team works in 3D first or pattern-led. Spreadsheets work for low-volume brands but break above 20 styles per season.
No. AI replaces the transcription and validation work, not the judgment about fit intent or fabric behavior. A technical designer using AI ships 4 to 6 times more charts per week with fewer factory rejections.
Between 30 minutes and 2 hours, depending on how clean your existing rules are. The setup is one-time per house standard.
Yes, but tolerance values differ significantly. Make sure the tool lets you set tolerance defaults per fabric class, not per style.
Run the chart through a factory-acceptance precheck, then send a sample chart for sign-off before issuing the full tech pack. The F* Word automates the first step. The second step is always manual.
If your last 5 tech packs came back from the factory with chart-related questions, that is a 70 percent indicator that a precheck would catch the issue. Start by listing the rejection causes from the last 6 months, then evaluate any tool against that list. Demo decks are useless. Your own rejection list is not.
Related: ai for fashion product development
Get The F* Word workflow insights in your inbox.